Knowledge synthesis: “Do Nature-based Solutions promote transformative change for sustainable use and management of biodiversity in socio-ecological systems? An evidence based approach”
Transformative change – a fundamental overhaul of technological, economic, and social systems (IPBES 2019) – is imperative to address the interconnected crises of climate change, biodiversity loss, and pollution. Nature-based Solutions (NbS) are increasingly recognised as potential catalysts for such a shift. However, our understanding of how NbS contribute to this profound transformation remains limited.
To bridge this gap, we conducted a systematic literature review to assess the extent to which NbS support transformative change. In addition, we sought to identify which NbS have been successful in bringing about transformative change and which type of transformative change is most likely to occur.
Two key takeaways
- As summarised below, the current gap in explicitly assessing different NbS outcomes and indicators of transformative change is a result in itself.
- However, case studies with comprehensive assessments reveal both synergies between NbS outcomes and the co-occurrence of these outcomes with indicators of transformative change, particularly over the long term (i.e., over 10 years, given the timescales over which NbS co-benefits often flourish and transformations unfold).
Methodology
The study assessed the relationship between NbS interventions and transformative change by reviewing case studies from the grey and peer-reviewed literature. It first assessed NbS outcomes according to the IPBES conceptual framework (Díaz et al. 2015) and then compared these to evidence of transformative change based on six indicators (Palomo et al. 2021).
- 71 case studies from 46 academic articles and 35 grey literature sources
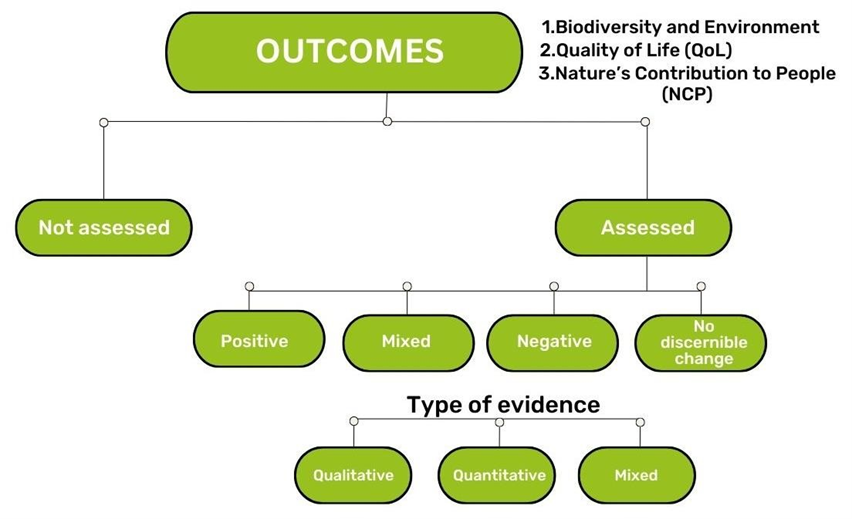
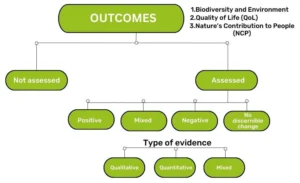
- 3 categories to assess NbS outcomes: Biodiversity & environment, Quality of life, and Nature’s Contributions to People
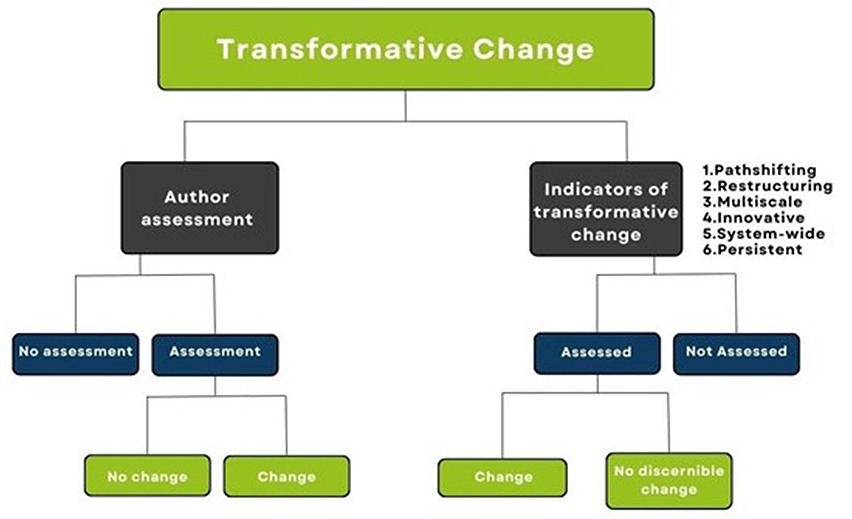
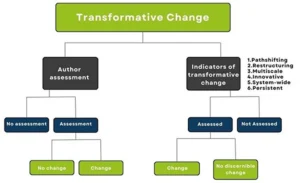
- 6 key indicators to assess transformative change: restructuring, path-shifting, innovative, multiscale, system-wide, and persistent nature
Assessment of NbS outcomes
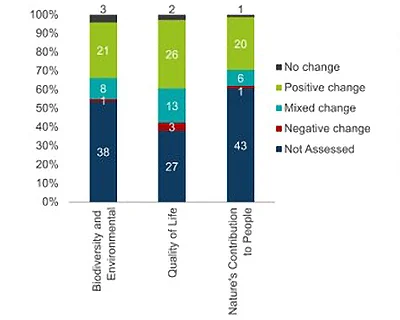
The case studies demonstrated positive outcomes across all three categories. When assessed, the observed changes were predominantly positive. However, there’s a need for more quantitative data. Additionally, the complex interplay between the three outcome categories highlights the importance of considering multiple perspectives when evaluating NbS projects.
- Quality of life was the most frequently assessed outcome.
- Nature’s Contributions to People exhibited the highest proportion of positive changes.
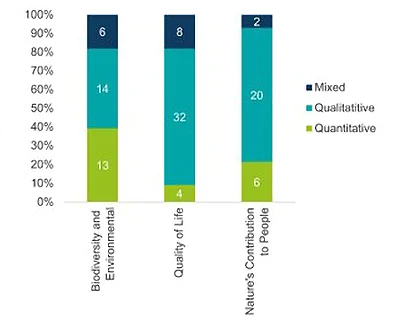
- Qualitative evidence was more common than quantitative evidence for all outcomes.
Assessment of transformative change indicators
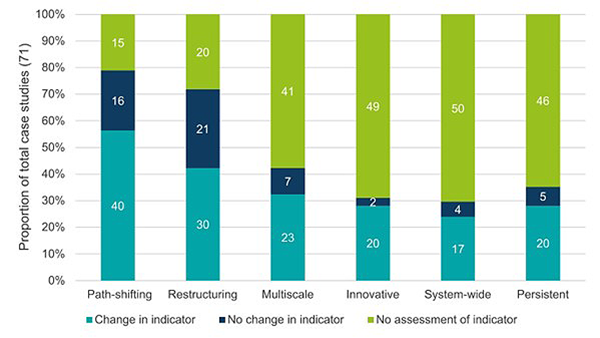
Path-shifting and restructuring were the most frequently assessed indicators, while innovative, system-wide, and persistent indicators showed change more often. The nature of some indicators may explain these differences. For example, some NbS interventions inherently involve path-shifting and restructuring, like reducing deforestation or changing agricultural practices. Local projects rarely show system-wide or multiscale change, and innovative interventions are typically not considered in mature NbS contexts. Interestingly, for the indicator of “persistent” change, results show comparatively more evidence of such change in studies conducted over 10 years after the intervention, compared to those from 0 to 10 years after the intervention. Only five studies assessed all indicators.
- The nature of the NbS intervention (e.g., scale & duration) influenced the occurrence of indicators.
- Restructuring and path-shifting changes were the most assessed indicators.
- Innovative, system-wide, and persistent indicators were less common but showed the highest rates of change.
Evidence of links between NbS outcomes and transformative change indicators
When considering both angles, the number of case studies that assess all three NbS outcomes and explicitly evaluate transformative change is limited. Out of the ten case studies that reported positive changes in each of the three outcome categories for NbS, only two explicitly evaluated transformative change. However, these case studies were more likely to assess and find changes in almost all indicators of transformative change, particularly for “path-shifting” and “restructuring” indicators. This highlights the synergies between positive NbS outcomes and the potential for NbS to create transformative change.
Findings varied by ecosystem and intervention type.
- Biome variations: In urban areas, assessments more frequently considered path-shifting and persistent indicators, while the restructuring indicator received less attention. Conversely, agricultural landscapes were more likely to assess the restructuring indicator and mountain areas were more likely to assess the system-wide indicator. Coastal and marine areas tended to assess multiscale and persistent indicators, likely due to complex governance structures.
- Intervention type variations: Restore and Protect interventions assessed path-shifting slightly more often. Protect and Conserve assessed restructuring less often. Conserve interventions less frequently assessed multiscale, innovative, or persistent indicators. Manage and Restore interventions found change in path-shifting more often.
The grey literature analysis corroborated the findings from the scientific literature. NbS projects were found to deliver positive environmental and social outcomes, with a focus on urban areas and interventions related to restoration and management. However, limitations in data availability, project definitions, and geographic scope hindered a more comprehensive assessment of transformative change.
Evaluation of transformative change indicators for the ten case studies that found assessed positive change in all three NbS outcome categories.
| Path-shifting | Restructuring | Multiscale | Innovative | System-wide | Persistent | |
|---|---|---|---|---|---|---|
| Change in indicator | 100% | 70% | 60% | 60% | 50% | 50% |
| No change in indicator | 0% | 10% | 0% | 0% | 10% | 0% |
| Not assessed | 0% | 20% | 40% | 40% | 40% | 50% |
Assessment of transformative change across biomes
| Number of case studies* | Path-shifting | Restructuring | Multiscale | Innovative | System-wide | Persistent | |
|---|---|---|---|---|---|---|---|
| Tropical Forests | 17 | 88% | 53% | 18% | 18% | 12% | 29% |
| Agricultural Landscape | 16 | 50% | 88% | 25% | 25% | 25% | 6% |
| Freshwater | 13 | 92% | 62% | 46% | 38% | 46% | 38% |
| Coastal | 12 | 92% | 58% | 83% | 42% | 25% | 67% |
| Marine | 8 | 88% | 100% | 63% | 38% | 50% | 75% |
| Grasslands/Savannas | 7 | 57% | 71% | 29% | 29% | 57% | 14% |
| Urban | 7 | 100% | 29% | 14% | 14% | 14% | 43% |
| Mountain areas | 6 | 67% | 83% | 50% | 33% | 67% | 33% |
| Mangroves | 2 | 100% | 50% | 50% | 50% | 0% | 50% |
| Deserts | 1 | 100% | 100% | 0% | 0% | 0% | 0% |
| Unclear | 1 | 100% | 100% | 100% | 100% | 100% | 0% |
| All Biomes | 71 | 79% | 72% | 42% | 31% | 30% | 35% |
Proportion of case studies in each intervention type that provided evidence that assessed each of the six indicators of transformative change
| Path-shifting | Restructuring | Multiscale | Innovative | Systemwide | Persistent | |
|---|---|---|---|---|---|---|
| Manage | 87% | 67% | 47% | 40% | 30% | 43% |
| Protect | 75% | 78% | 45% | 33% | 38% | 35% |
| Restore | 93% | 80% | 40% | 33% | 27% | 47% |
| Conserve | 76% | 76% | 24% | 18% | 29% | 24% |
Conclusions
Despite their potential, there’s limited research on how NbS can drive transformative change. The gap in explicit assessment of different NbS outcomes and indicators of transformative change is a result in itself. Evidence is often incomplete and lacks comprehensive evaluations across diverse scales and timeframes. Additionally, research tends to focus on specific biomes and regions.
Overall, although based on a minority of case studies where all three NbS outcome types are assessed, evidence shows a strong correlation with the occurrence of transformative changes, particularly for “path-shifting” and “restructuring” change indicators, due to the targeted outcomes of the NbS interventions and the inherent nature of NbS. These encouraging results provide strategic insights into the need for knowledge development at the nexus of NbS and transformative change for the sustainable use and conservation of biodiversity.
Hierarchy of categories used to assess outcomes of Nature based Solutions.
Hierarchy of categories used to assess transformative change in case studies.
Distribution of case studies across the five ‘evidence’ categories: not assessed, and positive, negative, mixed, and no change.
Distribution of evidence type for case studies where each outcome was assessed.
Distribution of the three evidence categories across the six indicators of transformative change.
Evaluation of transformative change indicators for the ten case studies that found assessed positive change in all three NbS outcome categories.
| Path-shifting | Restructuring | Multiscale | Innovative | System-wide | Persistent | |
|---|---|---|---|---|---|---|
| Change in indicator | 100% | 70% | 60% | 60% | 50% | 50% |
| No change in indicator | 0% | 10% | 0% | 0% | 10% | 0% |
| Not assessed | 0% | 20% | 40% | 40% | 40% | 50% |
Assessment of transformative change across biomes
| Number of case studies* | Path-shifting | Restructuring | Multiscale | Innovative | System-wide | Persistent | |
|---|---|---|---|---|---|---|---|
| Tropical Forests | 17 | 88% | 53% | 18% | 18% | 12% | 29% |
| Agricultural Landscape | 16 | 50% | 88% | 25% | 25% | 25% | 6% |
| Freshwater | 13 | 92% | 62% | 46% | 38% | 46% | 38% |
| Coastal | 12 | 92% | 58% | 83% | 42% | 25% | 67% |
| Marine | 8 | 88% | 100% | 63% | 38% | 50% | 75% |
| Grasslands/Savannas | 7 | 57% | 71% | 29% | 29% | 57% | 14% |
| Urban | 7 | 100% | 29% | 14% | 14% | 14% | 43% |
| Mountain areas | 6 | 67% | 83% | 50% | 33% | 67% | 33% |
| Mangroves | 2 | 100% | 50% | 50% | 50% | 0% | 50% |
| Deserts | 1 | 100% | 100% | 0% | 0% | 0% | 0% |
| Unclear | 1 | 100% | 100% | 100% | 100% | 100% | 0% |
| All Biomes | 71 | 79% | 72% | 42% | 31% | 30% | 35% |
Proportion of case studies in each intervention type that provided evidence that assessed each of the six indicators of transformative change
| Path-shifting | Restructuring | Multiscale | Innovative | Systemwide | Persistent | |
|---|---|---|---|---|---|---|
| Manage | 87% | 67% | 47% | 40% | 30% | 43% |
| Protect | 75% | 78% | 45% | 33% | 38% | 35% |
| Restore | 93% | 80% | 40% | 33% | 27% | 47% |
| Conserve | 76% | 76% | 24% | 18% | 29% | 24% |
