“Guide to using public biodiversity data in the private sector”
Published: January 2026 | DOI: 10.5281/zenodo.16967409
Over half of global GDP depends on ecosystem services. As frameworks such as CSRD and TNFD take hold, businesses are under growing pressure to make biodiversity risks, dependencies, and impacts visible in decision-making. Many organisations cite a lack of usable biodiversity data as a key barrier. In reality, vast amounts of biodiversity and nature-related data already exist. These data are produced by research institutions, government agencies, NGOs, citizen science initiatives, and private actors, and are increasingly accessible through public platforms and tools.
The challenge is not scarcity, but usability: knowing where to look, what data is fit for purpose, how to interpret it, and how to apply it responsibly in a business context. Importantly, organisations do not need perfect or complete biodiversity data to begin acting. Many companies and financial institutions are already using available public datasets to identify priorities, inform decisions, and build internal capacity. Starting with fit-for-purpose data, and improving over time, is often more effective than waiting for ideal information.
This guide helps bridge that gap. It explains how companies and financial institutions can find, assess, and use public biodiversity data to inform strategy, operations, and reporting. It offers:
- An overview of key public biodiversity data sources and what they contain
- Guidance on assessing data quality, resolution, relevance, and limitations
- Practical solutions to common challenges, including licensing, sensitive data, and comparability
- Workflows and a 5-step checklist for responsible data use
- Real-world case studies showing how organisations have turned data into action
Who is this guide for?
Different actors interact with biodiversity data in different ways. This guide is designed to support several key audiences.
Businesses integrating biodiversity into operations, strategy or reporting
Takeaways:
- Start now: Work with available public datasets to build familiarity and internal capability, even if data is imperfect.
- Integrate early: Embed biodiversity data into procurement, investment, and site planning processes, not only at the reporting stage.
- Build internal ownership: Clarify roles and responsibilities across sustainability, operations, and finance teams to avoid fragmented action and inconsistent use of data.
- Collaborate: Work with intermediaries and experts to tailor tools and provide feedback to data providers.
Financial institutions evaluating nature‑related risks and opportunities
Takeaways:
- Screen portfolios: Use public data and tools such as ENCORE to identify nature-related dependencies and impacts across portfolios.
- Engage investees: Use data-driven insights to engage portfolio companies on biodiversity performance, governance, and strategy.
- Prepare disclosure: Leverage available public data to build readiness for SFDR and CSRD reporting, clearly documenting assumptions and limitations.
Policymakers shaping incentives and infrastructure for corporate biodiversity action
Takeaways:
- Invest long-term: Treat public biodiversity datasets as critical infrastructure requiring stable funding.
- Support monitoring: Establish regional monitoring centres and long-term observatories to fill data gaps.
- Provide guidance: Develop reference datasets aligned with regulatory frameworks to guide corporate use.
Data providers and intermediaries making biodiversity data more usable for decision-making
Takeaways:
- Be transparent: Clearly document methodologies, limitations, licensing, and data lineage.
- Standardise: Align tools and outputs with international frameworks like TNFD, SBTN, and GRI.
- Educate: Provide training, sector-specific guidance, and applied use cases.
Standard-setting & reporting bodies aligning data requirements and definitions across frameworks.
Takeaways?
- Clarify expectations: Define data requirements under disclosure frameworks to reduce uncertainty.
- Align definitions: Agree on core metrics and taxonomies for concepts like ecosystem condition and species risk.
- Encourage integration: Promote the use of public data in reporting platforms and audit workflows.
Understanding the basics
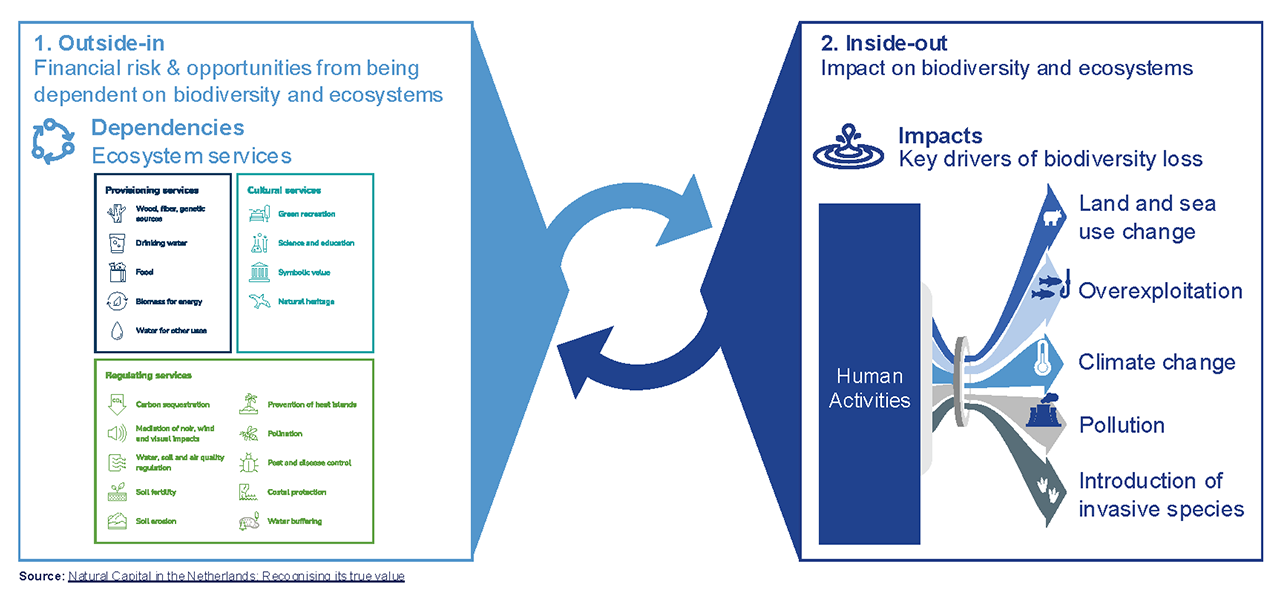
- Dependencies (outside-in): The ecosystem services an organisation relies on to function. For example, agriculture depends on healthy soils, clean water, and pollinators.
- Impacts (inside-out): Changes to the state of nature resulting from an organisation’s activities. These can be direct (e.g., land conversion) or indirect (e.g., supply chain pollution).
- Risks & opportunities: Dependencies and impacts translate into financial risks (e.g., operational disruption, regulatory penalties) and opportunities (e.g., sustainable innovation, access to green finance).
- The importance of location: Biodiversity risks and opportunities are highly location-specific. Spatially explicit data is critical for identifying sensitive ecosystems and guiding appropriate business responses.
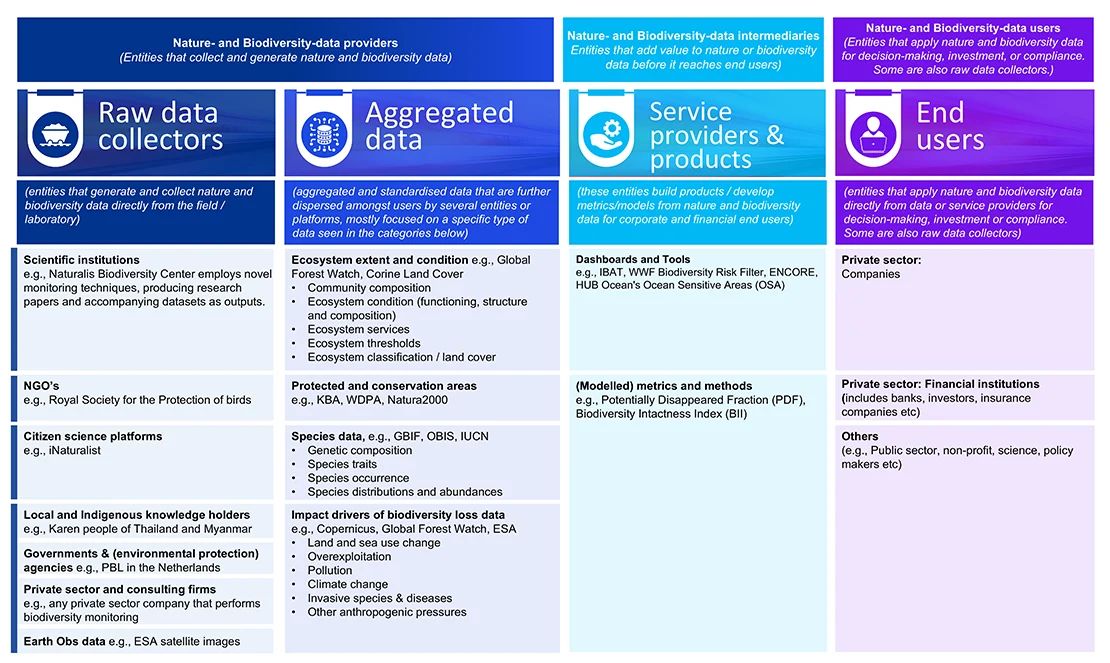
The report presents a landscape showing how biodiversity data flows through four key groups:
- Raw data collectors: Primary data is gathered by research institutes, NGOs, and citizen scientists using traditional field surveys alongside innovative techniques like eDNA sequencing, drones, and IoT sensors.
- Aggregators: Organisations like GBIF and OBIS centralise and standardise this scattered information, harmonising formats through frameworks like Darwin Core to ensure global interoperability.
- Intermediaries: These actors bridge the technical capacity gap by translating complex data into user-friendly dashboards (e.g., IBAT, ENCORE) and modelled metrics that quantify biodiversity state and pressures.
- End users: Companies and financial institutions apply these insights for double materiality assessments, risk management, and regulatory compliance.
While this system is complementary, its effectiveness depends on collaboration, interoperability, and a shared responsibility for data quality.
- ESG & Reporting: Using public data to inform double materiality assessments, a core requirement under the CSRD. This data helps contextualise site-level risks and populate indicators for biodiversity disclosures.
Key practices: Ensuring that all used datasets follow FAIR principles (Findable, Accessible, Interoperable, and Reusable). Explicitly documenting datasets and assumptions to improve auditability and confidence in disclosures. - Supply-chain screening: Overlaying supplier locations with public pressure layers (such as land-use change, pollution, or climate variables) to prioritise engagement and sourcing decisions.
Key practices: Using existing public data for initial screening even if it is imperfect, then complementing it with targeted local data or surveys where higher precision is required. Building familiarity with these datasets is essential for developing long-term internal capability. - Site selection & permitting: Integrating species occurrence data (e.g., from GBIF), habitat maps, and Earth observation data early in a project lifecycle to identify mitigation needs and reduce delays.
Key practices: Checking licence conditions (e.g., CC BY vs CC0) early to understand restrictions on commercial reuse. Supplementing public data with expert review or local ecological assessments where site-level precision is required - Innovation & product design: Applying open biodiversity data to develop nature-positive products, biodiversity-linked finance, or ecosystem service assessments.
Key practices: Collaborating with data intermediaries to translate raw scientific datasets into user-friendly metrics. Considering co-financing models for critical datasets to ensure their long-term continuity and business relevance.
Some of the most relevant platforms for business include:
- GBIF: The largest global database for species occurrence data. Essential for understanding species distribution and presence/absence in specific locations.
- OBIS: The leading global database for marine biodiversity data. Crucial for companies with coastal or offshore operations.
- Copernicus: Provides satellite-based geospatial data on land cover, land use, vegetation state, and water cycles across Europe. Crucial for assessing habitat extent and change.
- IBAT: Provides access to key global datasets like the IUCN Red List, World Database on Protected Areas, and Key Biodiversity Areas. Ideal for site-level risk screening.
- ENCORE: Helps financial institutions understand how economic sectors depend on and impact nature. Useful for portfolio-level analysis.
- WWF Risk Filter: A free online tool that helps companies assess and prioritise biodiversity-related risks across their operations and value chains.
The guide covers a broader set of portals, tools, and intermediaries, and explains when and how to use them.
Challenges & solutions
Across sectors, organisations face recurring barriers when using biodiversity data. These challenges are not only technical, but also organisational and institutional. The guide identifies five key challenges and outlines practical responses for different actors.
Limited ecological literacy and a lack of shared language make biodiversity data difficult to apply in business contexts. This often leads to misalignment between sustainability, operations, and finance teams, low confidence to act on biodiversity risks, and unclear ownership of data and decisions.
What helps:
- Businesses: Build basic biodiversity literacy through cross-functional training and shared internal guidance.
- Data intermediaries: Tailor tools and explanations to user profiles and business use cases.
- Policymakers: Support capacity-building and applied learning initiatives.
Public biodiversity data often has uneven coverage, varying resolution, and unclear licensing conditions. As a result, companies struggle to assess whether data is fit for site-level decisions, face hidden costs in cleaning and processing data, and hesitate to use data due to legal uncertainty.
What helps:
- Businesses: Use available data transparently, document limitations, and invest in priority datasets
- Data intermediaries: Clarify licences, improve metadata, and co-develop datasets with users
- Policymakers: Support long-term funding for monitoring and data infrastructure
Biodiversity data is distributed across many platforms with inconsistent standards, metadata, and methodologies. This makes it difficult to compare datasets, trace provenance, and establish credible baselines for target-setting and reporting.
What helps:
- Businesses: Adopt metadata standards and ensure continuity in datasets used over time
- Data intermediaries: Improve interoperability and alignment across tools and platforms
- Policymakers: Define priority use cases and promote harmonisation
Uncertainty about which data and methods are acceptable for compliance, combined with evolving regulatory expectations, discourages investment and slows action. Companies often struggle to demonstrate audit readiness or justify decisions under CSRD, SFDR, or related frameworks.
What helps:
- Businesses: Pilot approaches early and document assumptions and uncertainties
- Data intermediaries: Align tools with regulatory requirements and assurance needs
- Policymakers: Provide clearer guidance and harmonise expectations across frameworks
Biodiversity data is often introduced too late in decision-making, limiting its influence on site selection, sourcing, investment, or design. Measuring outcomes and attributing change to business actions remains challenging.
What helps:
- Businesses: Integrate biodiversity data early into planning and risk processes
- Data intermediaries: Embed data into operational tools and workflows
- Policymakers: Support place-based and landscape-level approaches
The ACT-D framework: from data to decision
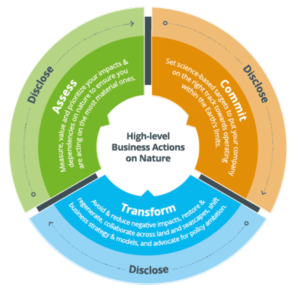
Most organisations follow a similar path when integrating biodiversity into decision-making. Understanding these phases helps clarify what data is needed at each point and what barriers you’ll encounter:
Identify where biodiversity risks, dependencies, and opportunities occur in your operations and value chains.
Common issues include:
Internal teams are often unaware of existing public biodiversity datasets or platforms. The landscape is vast and fragmented (e.g., GBIF, OBIS, national platforms, regional initiatives) making it unclear where to start.
Public biodiversity data is unevenly distributed geographically and by ecosystem type. Marine, freshwater, and soil biodiversity are underrepresented compared to terrestrial species. Coverage varies dramatically by region.
Company asset registries, supply chain data, and operational information are structured differently from biodiversity datasets. Spatial resolution, classification systems, and geographic boundaries don’t align, making integration difficult.
Set goals, targets, and internal governance structures to formalise your commitment to managing biodiversity.
Common issues include:
Public data often lacks historical depth, reference values, or clear definitions of what constitutes “healthy” or “degraded” ecosystems. Companies struggle to establish what a meaningful or credible target actually looks like.
Sustainability, operations, and finance teams use different terminology, metrics, and definitions. There is no common understanding of what biodiversity means for the business or how it should be measured and managed.
Integrate biodiversity into core operations, sourcing, and business models. Measure and report on effectiveness of interventions.
Common issues include:
Monitoring whether business interventions actually improve biodiversity is challenging. Public datasets may lack sufficient spatial resolution, temporal continuity, or timeliness to detect meaningful ecological change. Long-term monitoring is costly and often inconsistent.
It is unclear how much observed ecological change can credibly be attributed to a company’s specific actions versus external factors or broader ecosystem dynamics.
Report performance, risks, and dependencies under regulatory and voluntary frameworks to external stakeholders.
Common issues include:
Regulatory frameworks (CSRD, TNFD, SBTN, CSDDD) are emerging with different requirements, timelines, and interpretations. Companies struggle to know what data and methodologies are considered acceptable for compliance, and what constitutes “decision-useful” information.
Companies use different indicators, spatial boundaries, assumptions, and methodologies. This makes external comparisons, benchmarking, and credibility assessment difficult.
The ACT-D framework has been developed in a collaboration by leading organisations including the Capitals Coalition, Business for Nature, WBCSD, TNFD, Science Based Targets Network, WEF, and WWF.
Ready to start using biodiversity data?
The full guide supports organisations in taking informed first steps with the data that already exist, helping them build confidence, internal capability, and more robust biodiversity decision-making over time.
This guide is part of a broader set of Biodiversa+ reports on how biodiversity data are used and shared by businesses.


