“Biodiversa+ survey towards a roadmap on biodiversity monitoring novel technologies and approaches”
Published: September 2024 | DOI: 10.5281/zenodo.13880523
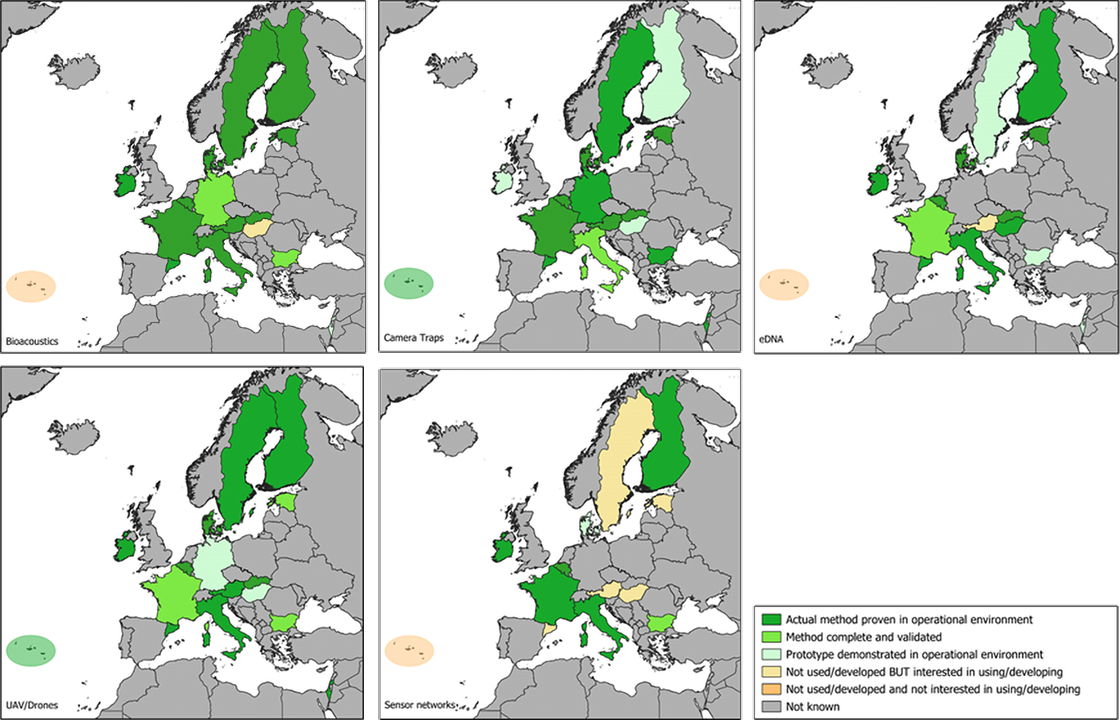
As part of its goal to support a pan-European network of harmonised biodiversity monitoring schemes, Biodiversa+ held an expert workshop in February 2023 to explore the opportunities and challenges of implementing novel technologies in biodiversity monitoring. Building on work by EuropaBON, a follow-up survey was conducted in spring 2024 to assess the use of five technologies—bioacoustics, camera traps, eDNA/genomics, UAVs (drones), and sensor networks—among Biodiversa+ partners. The survey also examined which taxa and Essential Biodiversity Variables (EBVs) these technologies target.
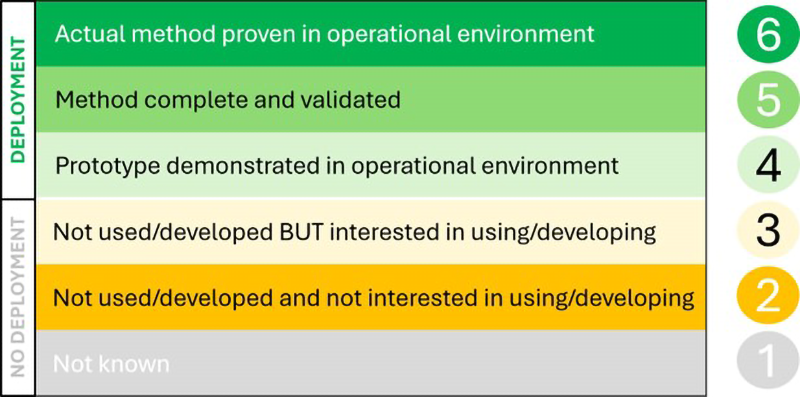
To assess deployment levels, the NASA Technology Readiness Scale was adapted, focusing on actual deployment and interest levels. A total of 21 respondents from 18 countries participated in the survey.
Takeaways
The limited number of respondents makes it difficult to generalise results, but some patterns can be described.
- The deployment of the five targeted technologies varies significantly. However, each method is fully deployed by at least one partner, indicating that the necessary knowledge for improvement is available within the Partnership.
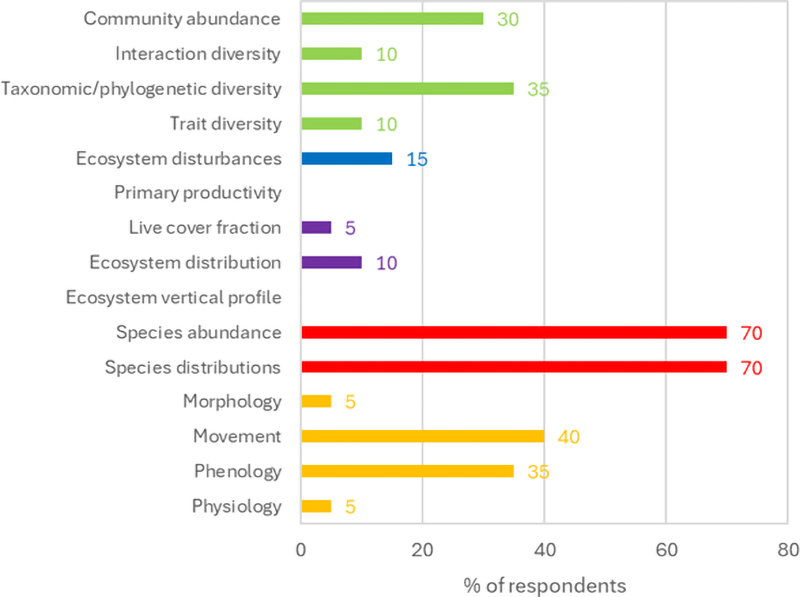
- There is a greater tendency to monitor species or community EBVs rather than ecosystem EBVs.
- Sharing experiences and developing common standards, protocols, and tools could help overcome technical challenges and reduce costs. Capacity-building webinars and workshops will be essential.
- Initiatives like eLTER and EBOCC can play crucial roles in supporting continuous development and standardisation.
Overall
- Highest deployment: Camera traps (16/21 respondents), eDNA (12/21), Bioacoustics (11/21).
- Lowest deployment: UAV/drones (8/21), Sensor networks (4/21).
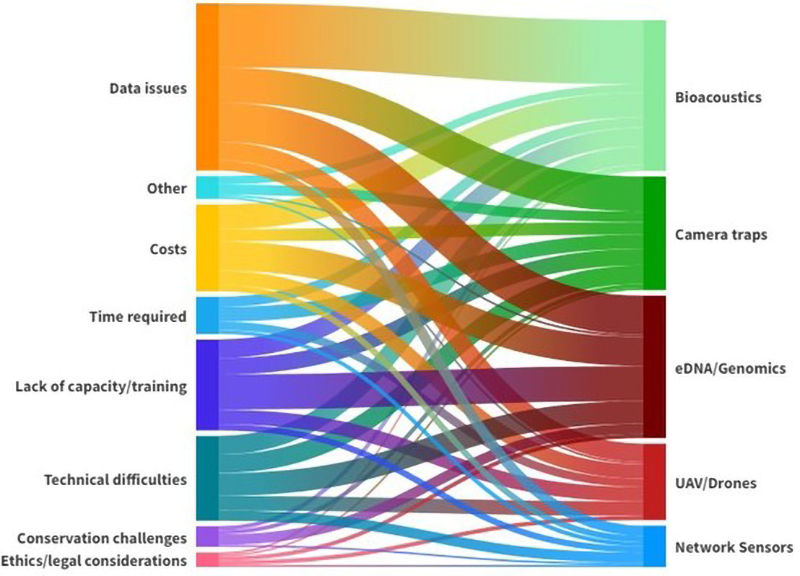
- Common constraints: Data issues are the most common (31%), including storage, analysis, synthesis, and integration, followed by lack of capacity/training, costs, and technical difficulties (each 16%).

Bioacoustics
- Devices used: Wildlife Acoustics Song Meters, hydrophones, ultrasound detectors, audiomoths, batlogger A+, BirdNET.
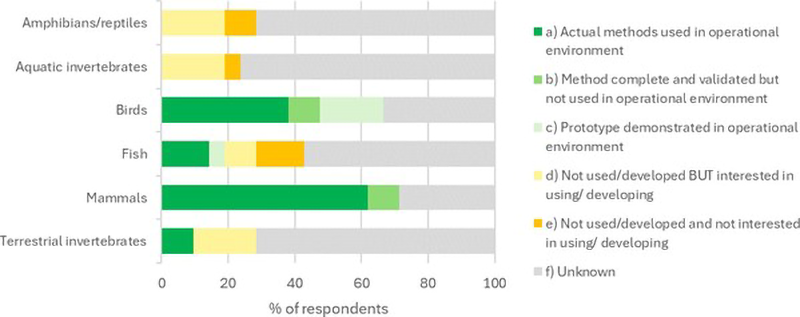
- Highest deployment for mammals (70%) and birds (65%).
- Lowest deployment for amphibians/reptiles and aquatic invertebrates.
- Common EBVs: Species distributions and abundances (both 70%).
- Common constraints: Data-related (41%), costs (16%), technical difficulties (12%), lack of capacity/training (12%).

Camera Traps
- Devices used: AMI traps, Model Wilsus, Wildlife Monitoring Solutions, CamAlien monitoring, Home Vista Secacam, Digital Trail Camera OGM H501.
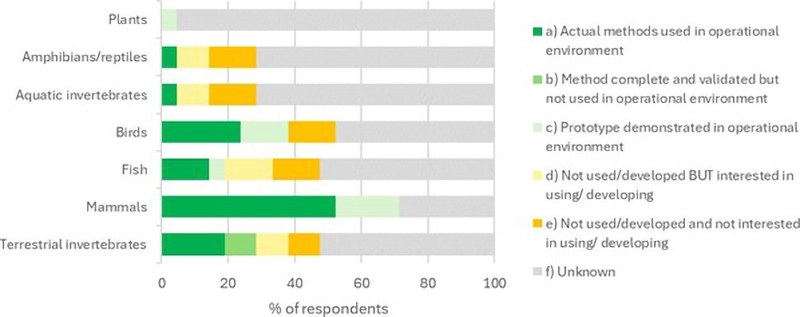
- Highest deployment for mammals (75%).
- Lowest deployment for plants, amphibians/reptiles, and aquatic invertebrates (5% each).
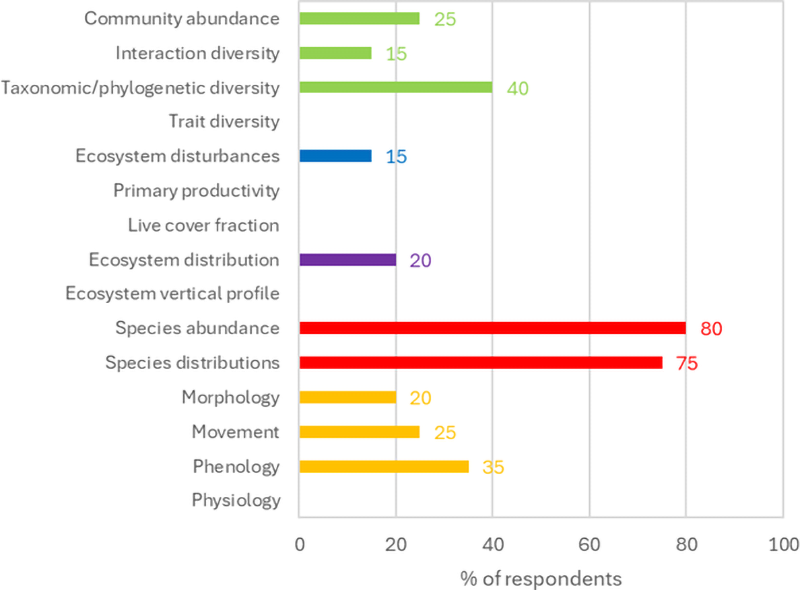
- Common EBVs: Species populations (80-75%).
- Common constraints: Data-related (29%), technical difficulties (16%), lack of capacity/training (14%), costs (10%).

UAV/Drones
- Uses: Lidar & thermal imagery, underwater monitoring, Multispectral and NDVI drones.
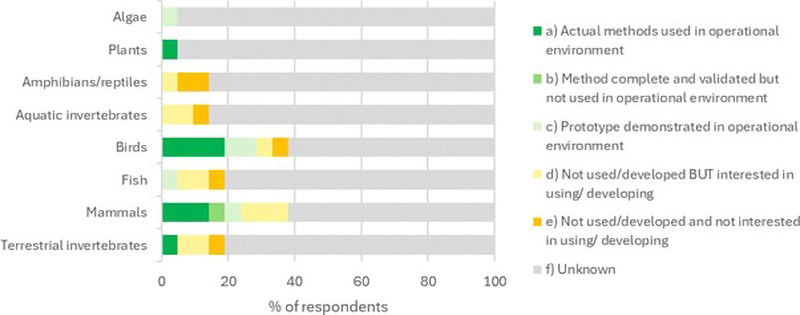
- Highest deployment for birds (30%) and mammals (25%).
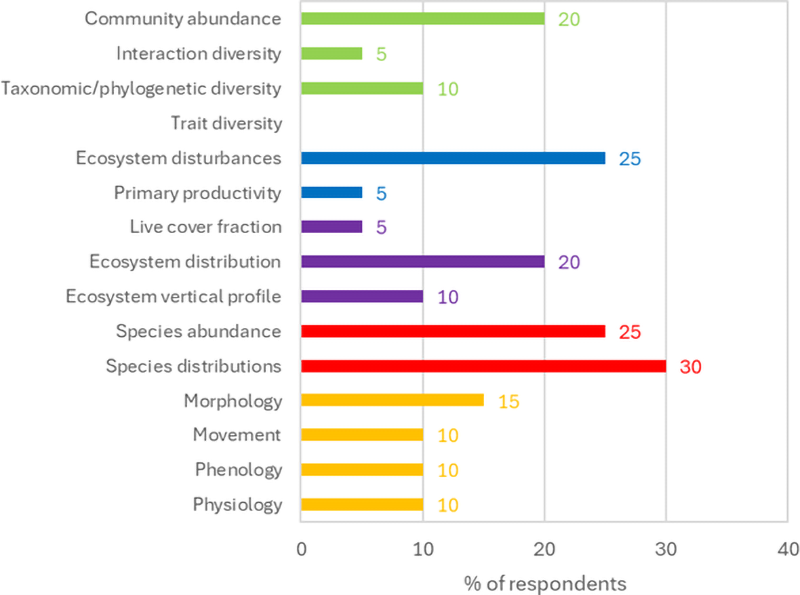
- Common EBVs: Species distributions (30%) and abundances (25%), ecosystem disturbances (25%).
- Common constraints: Data-related (24%), technical difficulties (18%), costs (18%), lack of capacity/training (14%).

eDNA
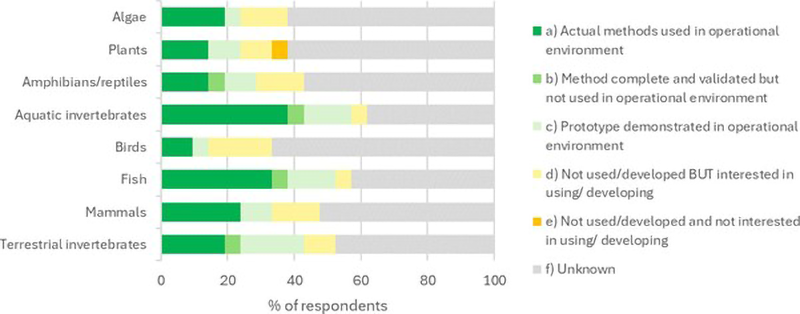
- Techniques: Metabarcoding, airborne eDNA, bat genomics, 12S genetic markers, IOLR, ddPCR, PCR-based techniques, qPCR.
- Highest deployment for aquatic invertebrates, fish, and terrestrial invertebrates (at least 45% each).
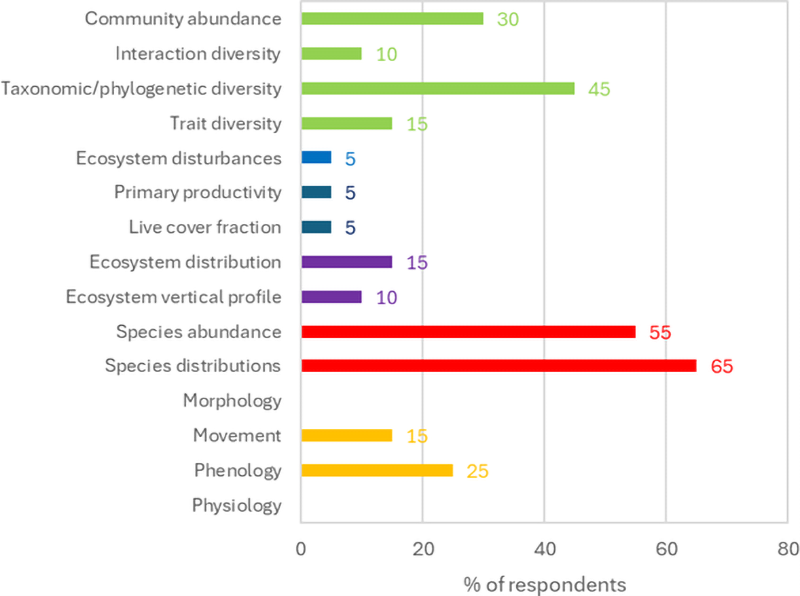
- Common EBVs: Species populations (55-65%), community composition (10-45%).
- Common Constraints: Data issues (27%), lack of capacity/training (24%), costs (20%), technical difficulties (18%).

Sensor Networks
- Methods: TMS4 loggers, sea monitoring programs, flux towers, 3D mobile bird radars, habitat monitoring ML software, organic sensors, Barotrauma detection systems.
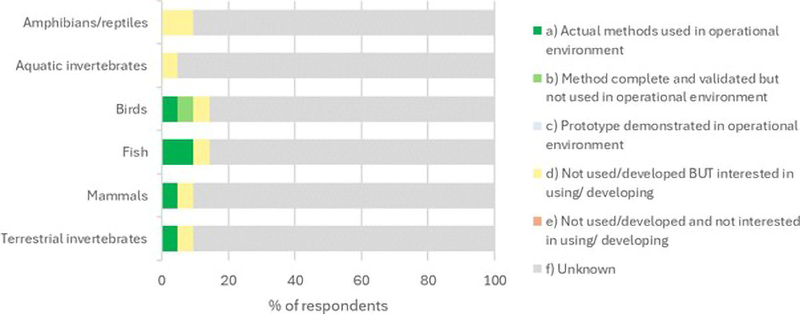
- Very low deployment and only for fish (10%).
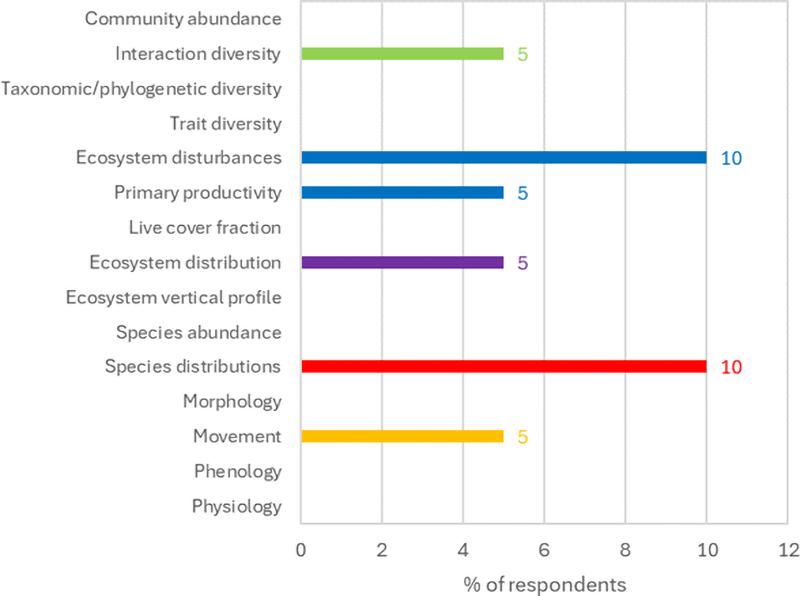
- Common EBVs: Species distributions and ecosystem disturbances (both 10%)
- Common Constraints: Technical difficulties (24%), data issues (24%), lack of capacity/training (14%), costs (14%).
By taxa
Mammals
- Common technologies: Bioacoustics, Camera traps.
- Constraints: Lack of funding.
Fish
- Common technologies: eDNA.
- Constraints: Poor standardisation, lack of reference libraries.
Birds
- Common technologies: Bioacoustics, UAVs, camera traps.
- Constraints: Data analysis and synthesis challenges.
Terrestrial Invertebrates
- Common technologies: Camera traps, eDNA.
- Constraints: Lack of comprehensive reference data/training libraries.
Aquatic Invertebrates
- Common technologies: eDNA.
- Constraints: Poor standardisation, lack of reference libraries.
Amphibians/Reptiles, Algae, Plants
- Common technologies: eDNA.
- Constraints: Need for validation and testing, low deployment levels for other technologies.
By EBVs
- Most monitored EBV groups: Species populations and community composition, especially species distributions and abundances variables.
- Least monitored EBV groups: Ecosystem structure and functioning.
- None of the respondents appeared to be monitoring aspects of EBV genetic composition.
- UAV/drones and bioacoustics were the most versatile technologies, monitoring nearly all EBVs, while sensor networks were the least used.
